

Freight transportation company Union Pacific (NYSE:UNP) fell short of the market’s revenue expectations in Q1 CY2025, with sales flat year on year at $6.03 billion. Its GAAP profit of $2.70 per share was 1.4% below analysts’ consensus estimates.
Is now the time to buy Union Pacific? Find out by accessing our full research report, it’s free.
Union Pacific (UNP) Q1 CY2025 Highlights:
- Revenue: $6.03 billion vs analyst estimates of $6.07 billion (flat year on year, 0.8% miss)
- EPS (GAAP): $2.70 vs analyst expectations of $2.74 (1.4% miss)
- Adjusted EBITDA: $2.98 billion vs analyst estimates of $3.05 billion (49.5% margin, 2.2% miss)
- Operating Margin: 39.3%, in line with the same quarter last year
- Free Cash Flow Margin: 21.6%, up from 8.7% in the same quarter last year
- Market Capitalization: $131.7 billion
“The team delivered a solid start to the year as we worked closely with our customers to meet their needs in an uncertain environment,” said Jim Vena, Union Pacific Chief Executive Officer.
Company Overview
Part of the transcontinental railroad project, Union Pacific (NYSE:UNP) is a freight transportation company that operates a major railroad network.
Rail Transportation
The growth of e-commerce and global trade continues to drive demand for shipping services, presenting opportunities for rail transportation companies. While moving large volumes by rail can be highly cost-efficient for customers compared to air and ground transport, this mode of transportation results in slower delivery times, presenting a trade off. To improve transit times, the industry continues to invest in digitization to optimize fleets, loads, and even braking systems. However, rail transportation companies are still at the whim of economic cycles. Consumer spending, for example, can greatly impact the demand for these companies’ offerings while fuel costs can influence profit margins.
Sales Growth
Reviewing a company’s long-term sales performance reveals insights into its quality. Any business can put up a good quarter or two, but the best consistently grow over the long haul. Regrettably, Union Pacific’s sales grew at a sluggish 2.4% compounded annual growth rate over the last five years. This fell short of our benchmarks and is a poor baseline for our analysis.
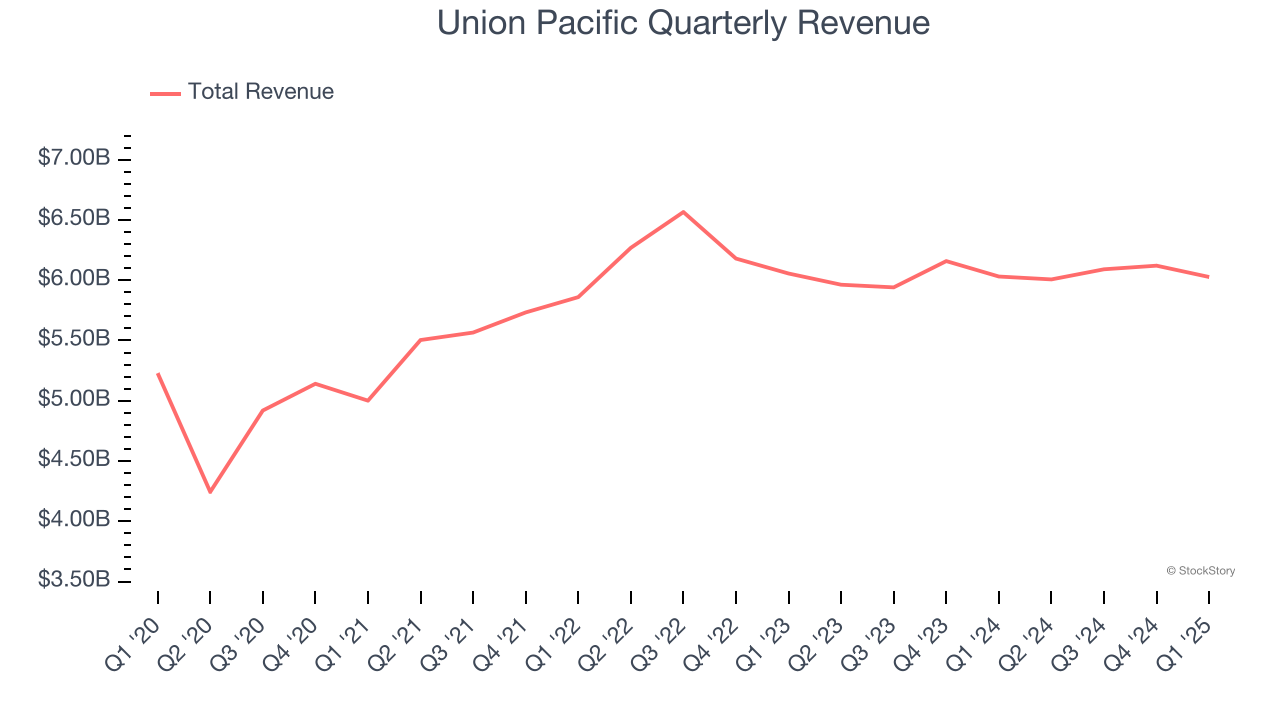
Long-term growth is the most important, but within industrials, a half-decade historical view may miss new industry trends or demand cycles. Union Pacific’s performance shows it grew in the past but relinquished its gains over the last two years, as its revenue fell by 1.7% annually. Union Pacific isn’t alone in its struggles as the Rail Transportation industry experienced a cyclical downturn, with many similar businesses observing lower sales at this time. 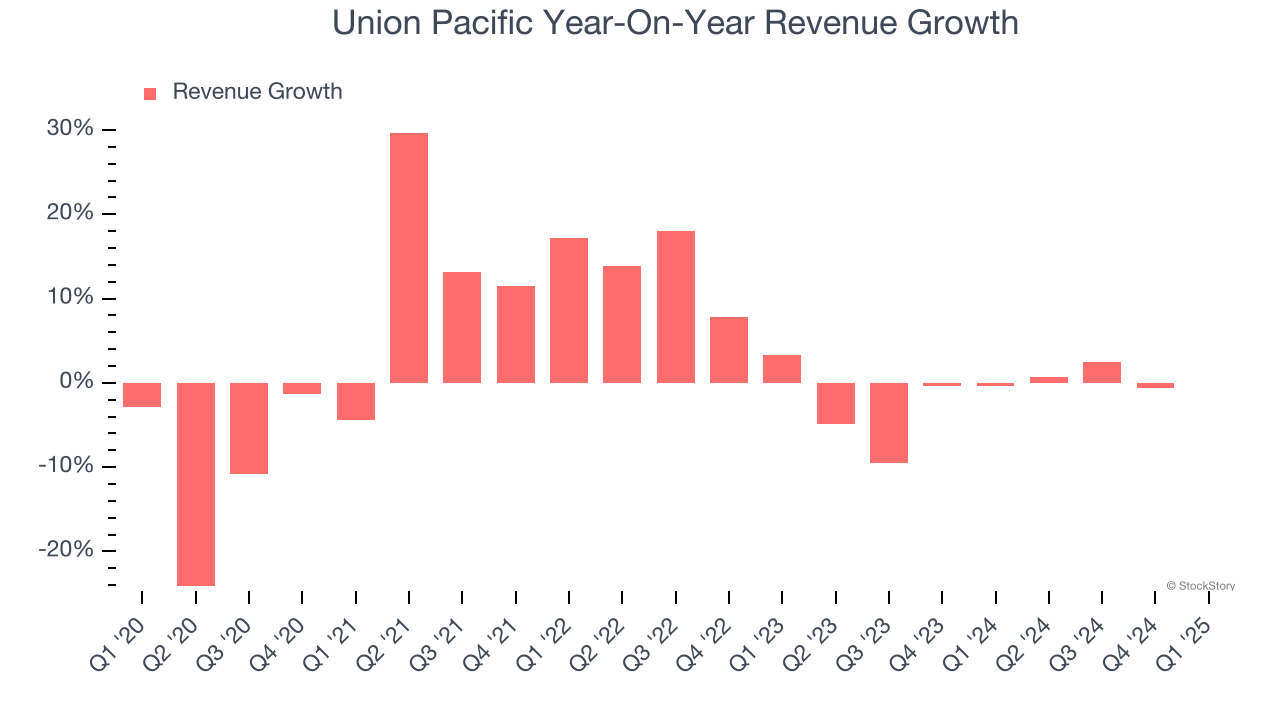
This quarter, Union Pacific missed Wall Street’s estimates and reported a rather uninspiring 0.1% year-on-year revenue decline, generating $6.03 billion of revenue.
Looking ahead, sell-side analysts expect revenue to grow 3% over the next 12 months. Although this projection suggests its newer products and services will fuel better top-line performance, it is still below average for the sector.
Unless you’ve been living under a rock, it should be obvious by now that generative AI is going to have a huge impact on how large corporations do business. While Nvidia and AMD are trading close to all-time highs, we prefer a lesser-known (but still profitable) stock benefiting from the rise of AI. Click here to access our free report one of our favorites growth stories.
Operating Margin
Operating margin is a key measure of profitability. Think of it as net income - the bottom line - excluding the impact of taxes and interest on debt, which are less connected to business fundamentals.
Union Pacific has been a well-oiled machine over the last five years. It demonstrated elite profitability for an industrials business, boasting an average operating margin of 40%. This result isn’t surprising as its high gross margin gives it a favorable starting point.
Looking at the trend in its profitability, Union Pacific’s operating margin might fluctuated slightly but has generally stayed the same over the last five years. This raises questions about the company’s expense base because its revenue growth should have given it leverage on its fixed costs, resulting in better economies of scale and profitability.
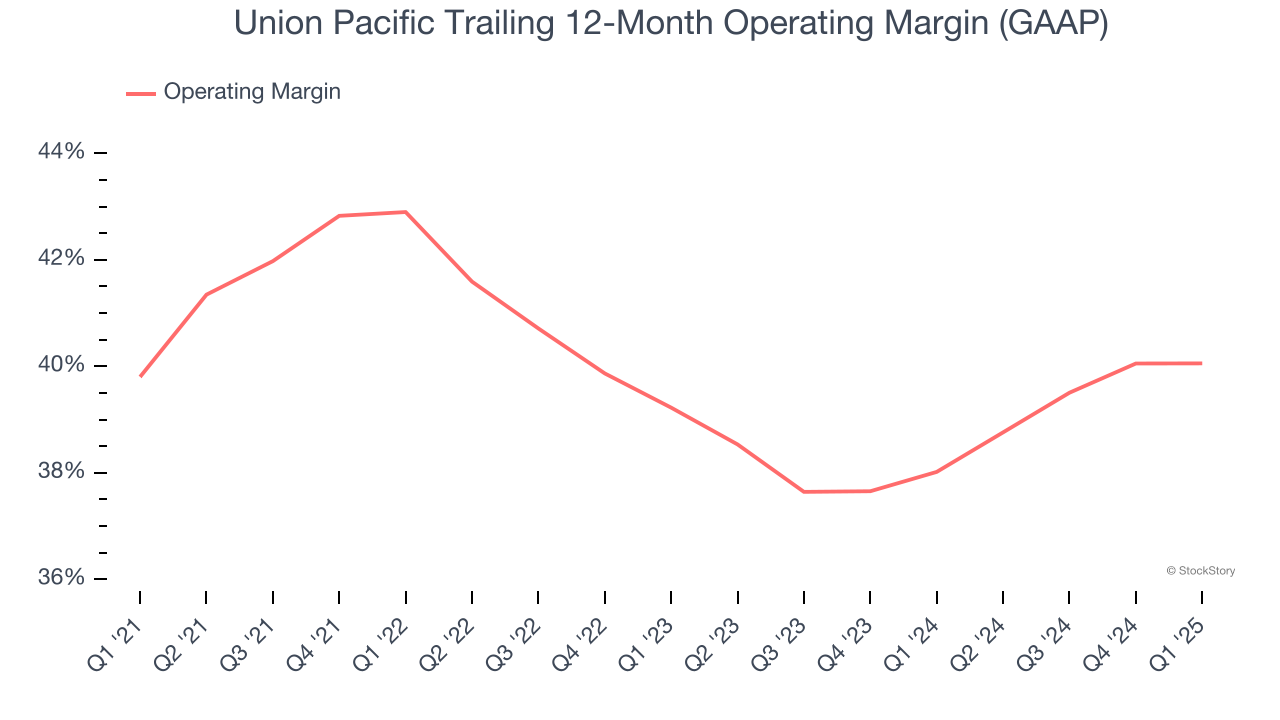
In Q1, Union Pacific generated an operating profit margin of 39.3%, in line with the same quarter last year. This indicates the company’s cost structure has recently been stable.
Earnings Per Share
Revenue trends explain a company’s historical growth, but the long-term change in earnings per share (EPS) points to the profitability of that growth – for example, a company could inflate its sales through excessive spending on advertising and promotions.
Union Pacific’s EPS grew at an unimpressive 5.2% compounded annual growth rate over the last five years. This performance was better than its flat revenue but doesn’t tell us much about its business quality because its operating margin didn’t expand.
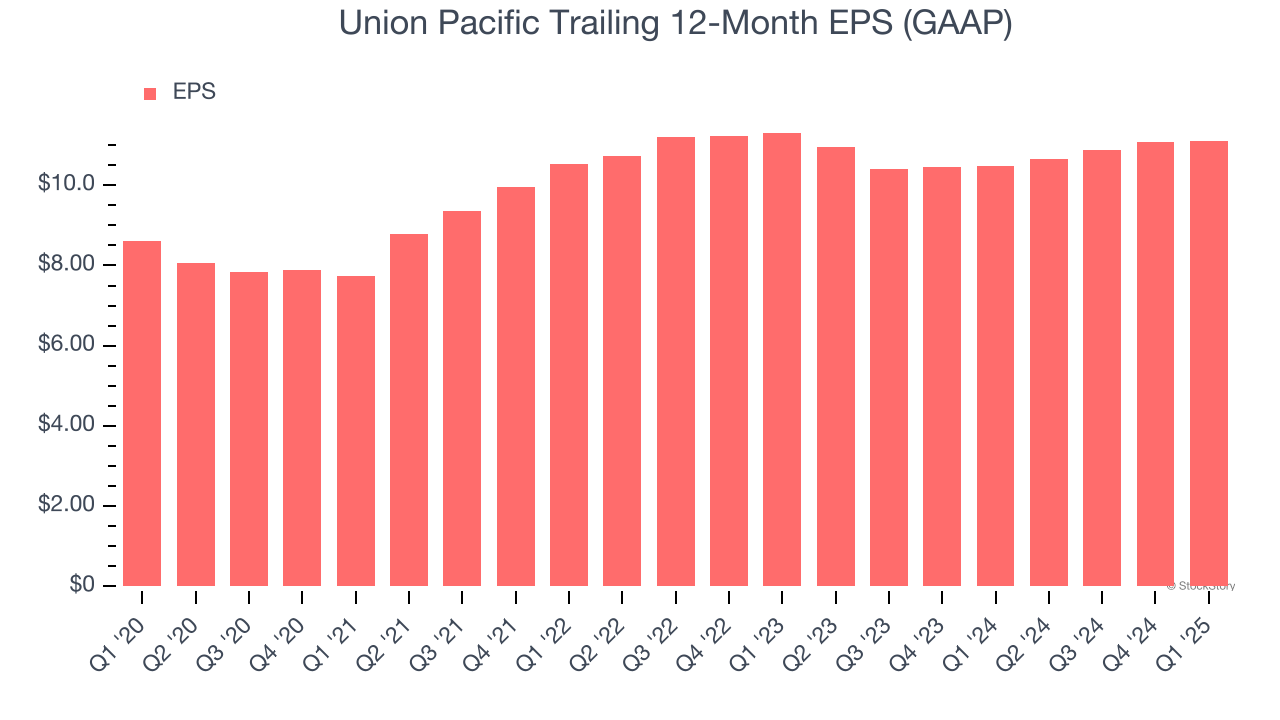
Diving into the nuances of Union Pacific’s earnings can give us a better understanding of its performance. A five-year view shows that Union Pacific has repurchased its stock, shrinking its share count by 12.3%. This tells us its EPS outperformed its revenue not because of increased operational efficiency but financial engineering, as buybacks boost per share earnings. 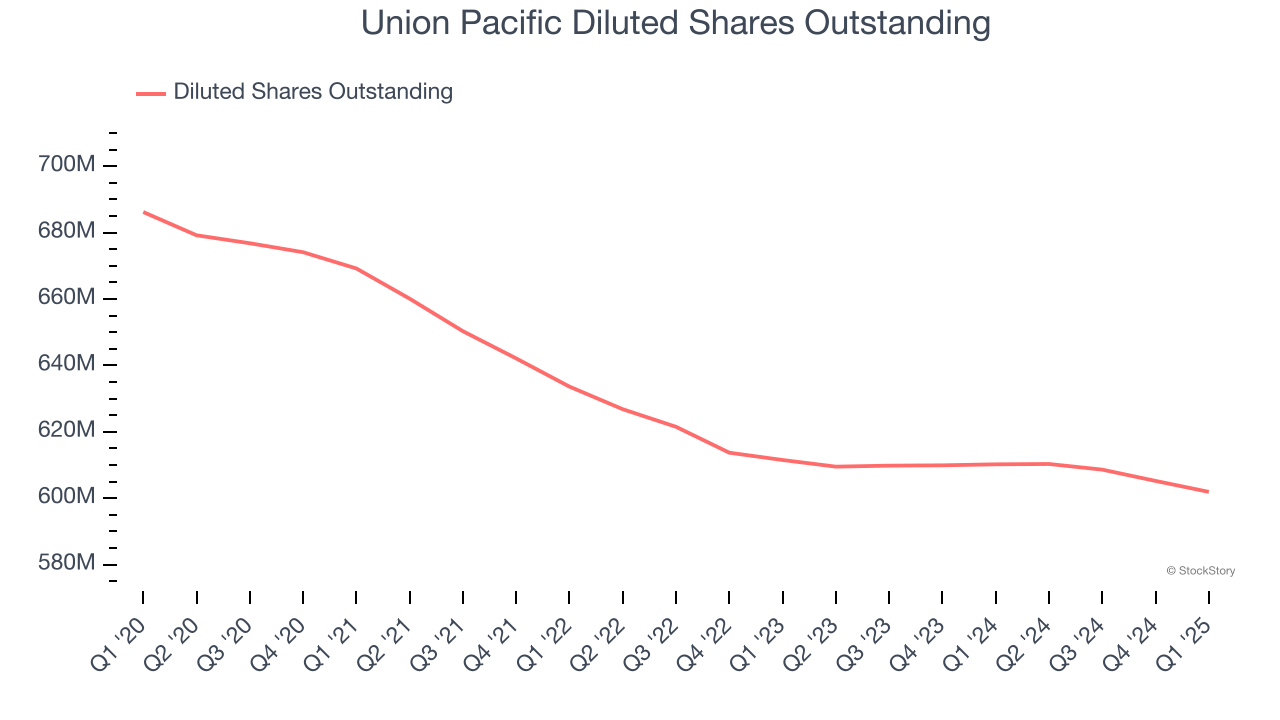
Like with revenue, we analyze EPS over a more recent period because it can provide insight into an emerging theme or development for the business.
For Union Pacific, EPS didn’t budge over the last two years, a regression from its five-year trend. We hope it can revert to earnings growth in the coming years.
In Q1, Union Pacific reported EPS at $2.70, up from $2.69 in the same quarter last year. Despite growing year on year, this print slightly missed analysts’ estimates. Over the next 12 months, Wall Street expects Union Pacific’s full-year EPS of $11.10 to grow 8%.
Key Takeaways from Union Pacific’s Q1 Results
We struggled to find many positives in these results as its revenue, EPS, and EBITDA fell short of Wall Street’s estimates. Overall, this quarter could have been better. The stock traded down 3.9% to $211 immediately following the results.
Union Pacific didn’t show it’s best hand this quarter, but does that create an opportunity to buy the stock right now? We think that the latest quarter is only one piece of the longer-term business quality puzzle. Quality, when combined with valuation, can help determine if the stock is a buy. We cover that in our actionable full research report which you can read here, it’s free.